Posts

Can you teach an old body new tricks? Evaluating metabolic efficiency one year later


Where I began

Almost exactly a year ago, I did a metabolic efficiency (ME) test at Silver Sage Sports and Fitness Lab. In my blog last year, I discussed fuel sources and what the ME test evaluates, namely, it tells us how well our body utilizes fat versus carbohydrate as an energy source.


The results of my 2017 test were a bit sobering — I did not burn fat when riding my bike. Like, not at all. The graph is supposed to show, among other things, when you are burning 50% fat and 50% carbohydrate, or your cross-over point. After your cross-over point, carbohydrate as a fuel source increases, while fat utilization decreases. One minute into my test — my respiratory exchange rate (RER) was .82 (.85 is considered the 50/50 point). The test ends when RER hits .9 and mine ended when I reached just 166 watts.

2017-fueluse-power


2017-fule use-hr


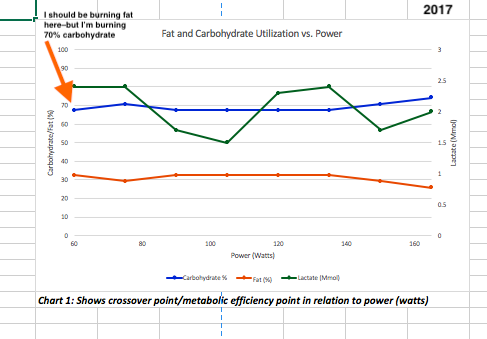
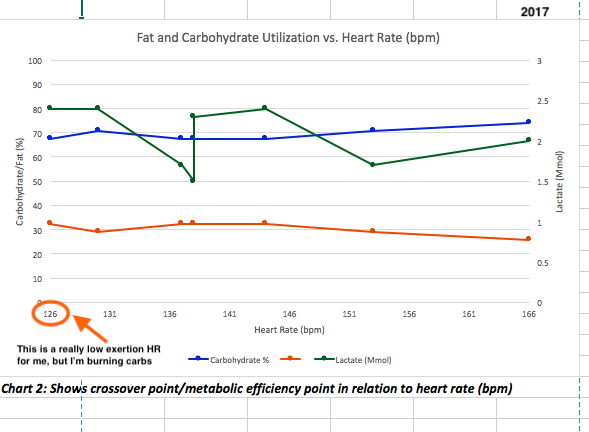
If you take a look at my graph from February 2017, you’ll notice there is no cross over, just a blue carbohydrate line hanging out high above a fat burning line. From the start of the test, at a mere 60 watts (you know, barely pedaling), I was not burning fat. As far as the test was concerned, I hardly burned any fat while riding my bike.


Also of note, is my lactate line (the green one.) Lactate is a by-product of your metabolism that is produced during exercise. Mine is kind of janky in the graph, straightish with drops – there is no trending curve. The blood lactate profile is considered the most important predictor of endurance performance potential in steady-state events. So, this would seem to indicate I didn’t have much of an endurance base.


Together, this information was not painting an optimal picture for someone who competed in events ranging from :45 minutes (cross) to over 4 hours (mountain biking and endurance gravel).


What I did

At the time of my 2017 test, I was just starting a year of training with Julie Young. She, and my research, indicated that I could actually affect my metabolic efficiency by making changes to my diet and training – namely, starve my body of carbs and ask it to do low intensity work. So, for the past year, that is what I did.


Julie’s program included much more low and medium endurance zone riding than I had done in the past (I had always thought, going hard got you fitter, faster. I was wrong). In addition to Julie’s structured training, I changed my diet pretty significantly. I reduced my intake of carbohydrates to about 25-35% of total calories (more meat, lots of nuts, copious amounts of veggies, cut out bread and pasta) and I cut out sugar almost entirely (just eating fruit sugar).


My 2018 results

In the course of a year, I completely turned my fuel utilization around. While the blue line (carbohydrates) was on top last year, the red (fat) line is on top this year! Using the same testing protocol as last year, slowly increasing power with a lactate blood test every 3 minutes, I started the test using nearly 90% fat as fuel (vs 32% last year) with a respiratory exchange rate (RER) of .74 a minute into test. My cross-over (the 50/50 carb/fat utilization) was 21 minutes in at 165 watts. At the end of the test, when RER hit .9, I was at 195 watts (vs 166 last year).

2018-fuelusepower

2018-fueluse-hr

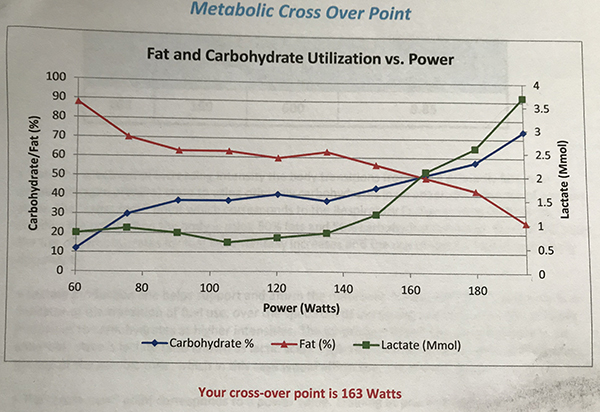
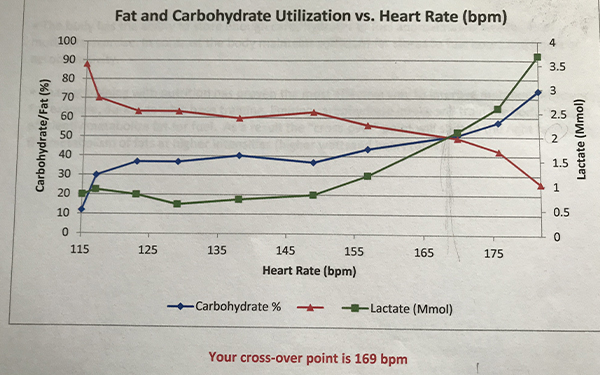
And take a look at my lactate, the green line. It’s got a curve! This indicates some actual aerobic fitness. Which, in retrospect, indicates I didn’t have much last February.


What it all means

Hypothetically, I can now go longer with less fuel because my body can use its own stores better. Very exciting! Yet, what does it really mean?


Looking back on the goals I hoped to work toward using information from this test: I hoped to get a handle on my race cramping and on fading at the end of a race.

Did my cramping go away? No.

Did my racing stay more consistent? While I had a pretty disappointing year, results wise, there is evidence my shorter cross races were more consistent lap-to-lap. All of my long races were derailed by cramping at some point, so I cannot evaluate positive changes to my staying power.


I do notice that I don’t get the spikes in hunger like I used to — I don’t get hangry as often. I need much less food when I train now. I can get up and do a two-hour ride with no food. During a 3-4 hour ride, I drink one endurance bottle, a bar and a few nuts.


How to put the data to work

I have more longer endurance events on this year’s schedule, so it is reassuring to know that my metabolic efficiency is now on board with that plan. I have force fed myself during races for fear of bonking (which is a pain to do at race pace and also causes stomach upset), and now I know I don’t need that much in-event fueling. I also have a clearer understanding of how to fuel my training – low intensity efforts get fat, high intensity efforts get carbs. I certainly understand the value of all the low intensity volume Julie had me do and, now that I’m training myself, I have to be careful not to fall into old habits of riding shorter and harder. While it conserves time, it doesn’t make me perform better.


There is definitely value to knowing the science behind your performance. Even if you’re a middle-aged, working, mom-of-a-high-schooler, master’s rider – maybe especially if you are one. We don’t have time to waste doing it wrong.


Check out the menu of physiologic testing available at Silver Sage. It’s pretty impressive the quality of the testing tools that are available to us.


Next up, I need to dial in my lactate threshold to make sure my training zones are accurate.


Performance Metabolic Efficiency Assessment

What is it and what can it do for you?

by Paige Galeoto

Like many of you, I’ve been riding and competing for many years (sometimes at a national level, often with friends on the local single track). And like many of you I have been winging it, using my experience and knowledge to try and go faster and tire slower. Whether you are a cyclist like me, a runner or other endurance athlete, you’ll likely agree that the older we get, the more important it becomes to train “smarter,” not just harder or longer.

While I acknowledge (begrudgingly) that I have gotten slower as I’ve aged, I have not lost my desire to compete and be challenged. So, how do I keep moving my own personal bar forward? Science! In the form of physiologic testing at Silver Sage Sports and Fitness Labs.

To get this science-informed training going, I scheduled a metabolic efficiency assessment with Julie Young at Silver Sage one Friday afternoon this past February.

What is Metabolic Efficiency?

Our bodies rely on two sources of energy to perform:

  1. Carbohydrates
  2. Fat

We’ve all heard of carbo-loading before races or big events. The reason we load up on this fuel source is carbohydrates are most quickly converted into energy. However, the body can only store about 2,000 calories of carbohydrates (in the form of glycogen) so you and I will run out of carb energy after 2-3 hours of moderate exercise. In contrast, fats are more slowly converted into energy and the body has tons of fat to draw on (nothing personal, we all have tens of thousands of calories to draw on, no matter our size).

A metabolic efficiency assessment (ME) tells us how well our body utilizes fat as an energy source. Armed with this info, you can improve your efficiency through exercise and nutrition.

The test is particularly valuable for true endurance athletes whose target events are 4 to 6 hours or more, but even for those whose events are shorter (my target events range from 45 minutes to four hours) this information can help us maintain energy and performance levels throughout any event without trying eat constantly. I wanted help tackling these challenges:

  • Cramping at about the 2 ½ hour mark of a race or hard effort
  • Fading near the end of a race (of any length) after a strong start

The test

Unlike a VO2 max test, the ME test is not an all-out, tongue-to-your-knees effort. The test at Silver Sage was done on their trainer, using my bike. You get to wear some fancy head gear with a tube connected to your mouth and your nose plugged (testing your respiration gasses), and a heart rate monitor strap. It’s a bit awkward, but the effort is a low cadence endurance effort so no labored breathing.

You pedal easy, increasing 10 to 25 watts every five minutes. And every five minutes, Julie pricks your ear to take a blood sample and get your lactate level. (It doesn’t hurt, promise.) The whole thing takes about an hour.

Upon completion, this is what you’ll learn:

  1. Caloric expenditure at various heart rates and intensities
  2. How to preserve carb stores to decrease the required fuel replenishment
  3. How to increase fat as fuel, so you can perform workloads faster and longer
  4. Lactate levels for your various metabolic zones

What to do with your data:

A few days later, Julie sent me my results. The executive summary: I do not burn fat — at all. It’s all very math-ey, but the point where I am burning equal parts carbs and fat — which you’d hope would be well into your endurance zone, is 75 watts or 130 heart rate. For me that’s barely moving. In contrast, Sian Turner, a pro-level cyclist and triathlete who is quite efficient in her metabolism, burns equal parts carbs and fat up to 180 watts. And she improved that number from 110 watts, over the course of a year, the same way I will attempt to improve mine:

  1. Exercise more at lower intensities, especially early in a training cycle
  2. Support stable blood sugars by eating more lean proteins, healthy fats, fruits, and vegetables instead of high carbohydrate food

Me_test

Nutrition as asset

I took this test because I am committed to making an improvement in my cycling performance. For me, the results have led to a pretty significant change in my diet. While I’ve always eaten what I considered good, healthy food, I was very carb heavy and I was consuming more processed carbs than I realized. I spent 6 weeks limiting my carb intake to 25 percent of calories and am now allowing myself about 35 percent (I followed the Always Hungry plan at the recommendation of another endurance athlete). I also started training with Julie, who has me spending more time in low and medium endurance zones than I have ever trained in before in my 25 years of cycling.

I am still relatively early in my process. Seven weeks after adjusting my diet and five weeks after starting my new training program, I had a “test” – a rolling metric century with a group of hard-charging friends. Fueled with almost all fat and protein, I rode four hours and climbed 3,500 feet without bonking or cramping. However, at the final rest stop I ate some potatoes which provided a nice energy surge for the final miles.

This reinforces another point both Julie and Sian made to me — phase your nutrition with your training. While I am doing some experimenting with my diet right now, I am erring on the extreme side and finding the break points. Our daily nutrition needs can and should change with our workouts. On a rest week I can really lower carbs, but for my upcoming race I will fuel the night before and day of with carbs and also use carbs in recovery. An all or nothing approach is not ideal.

Take away

Do less guessing. Let science aid your training efforts by telling you where your deficiencies are and how you can train smarter, not harder. As athletes, we are extremely lucky to have Silver Sage’s Olympic-training center caliber testing facilities available and a testing staff that knows how to help you translate that data into performance gold.

See you at the start line.